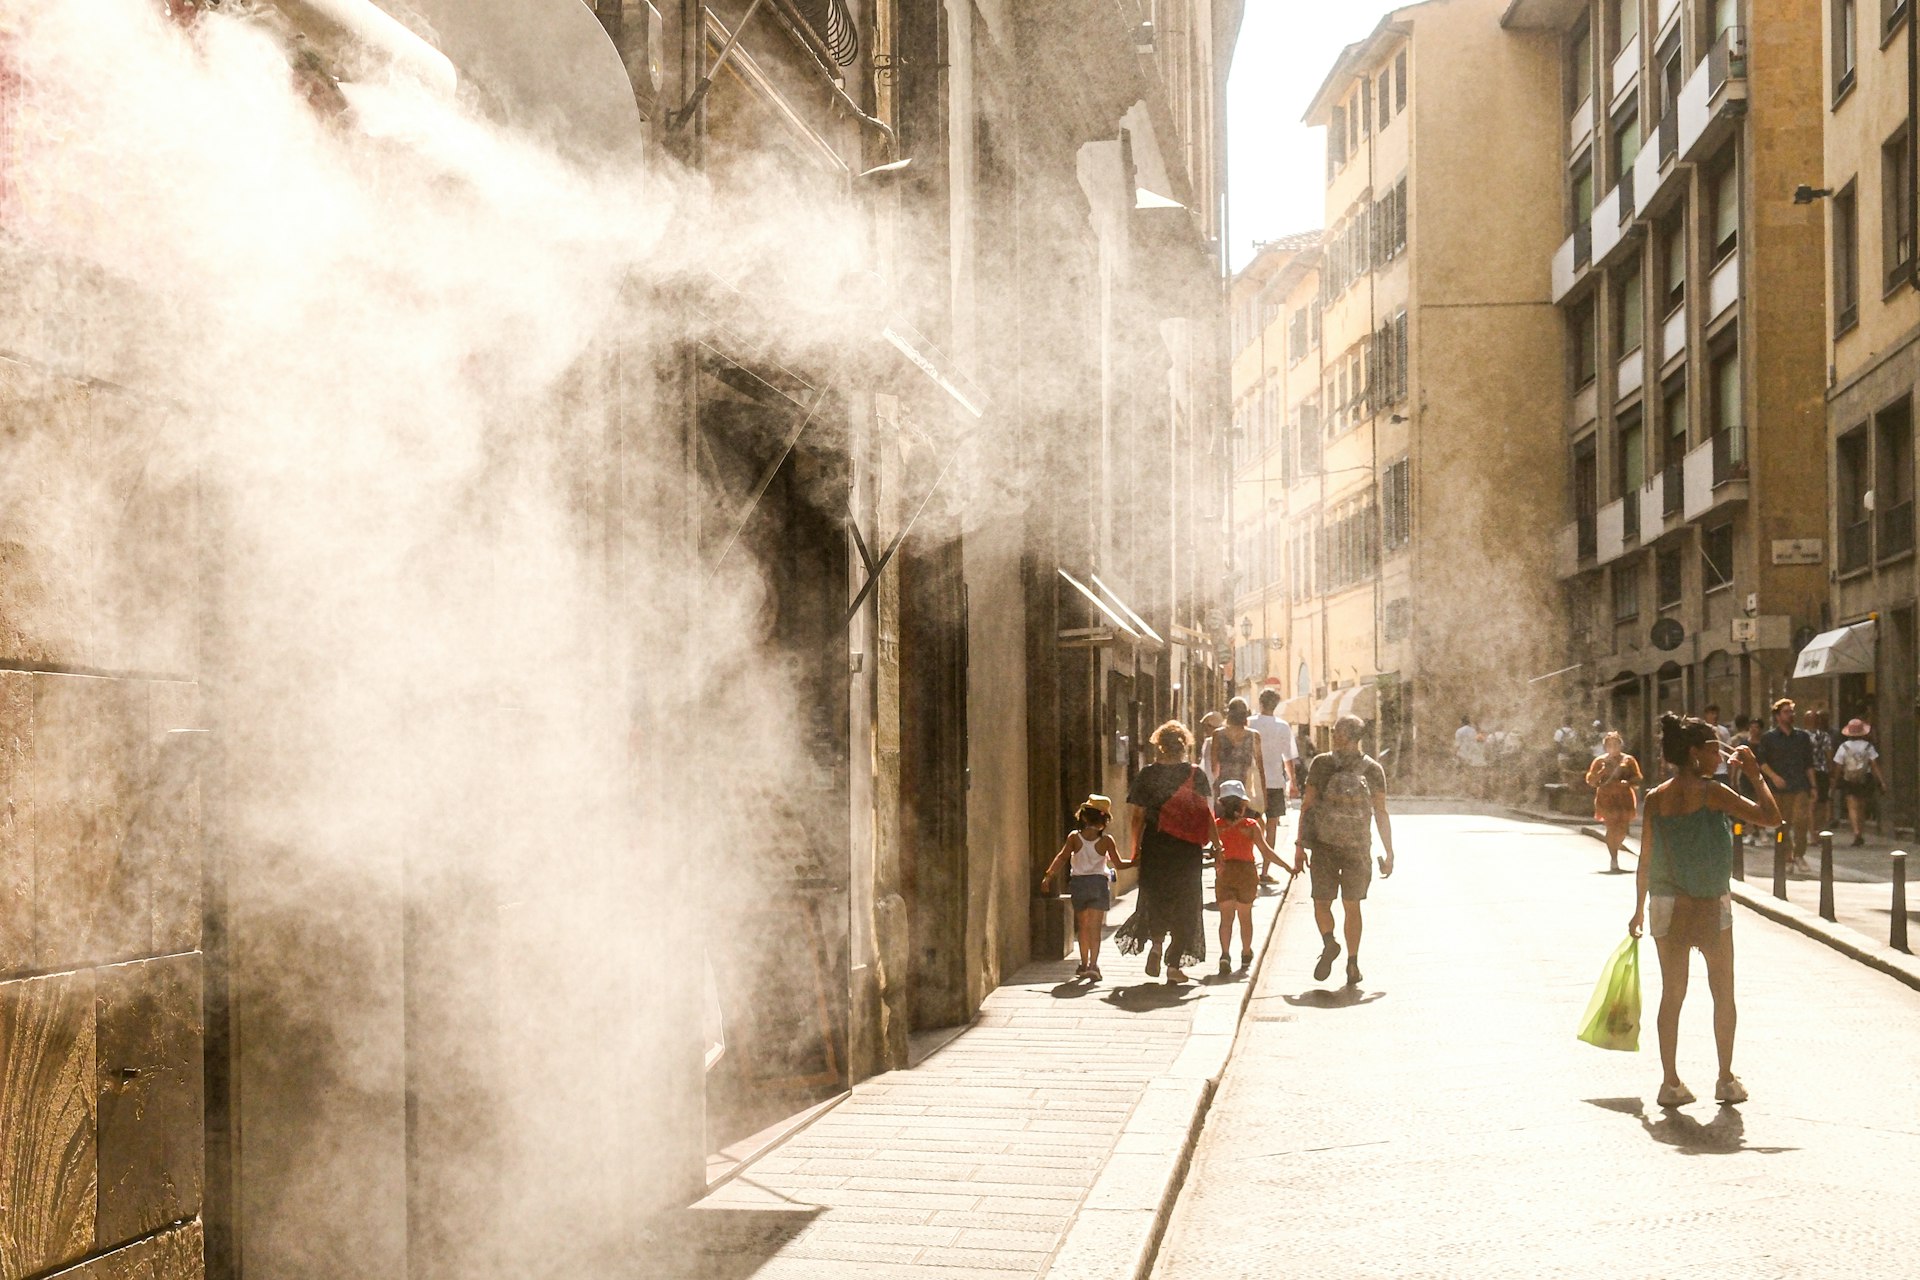
On March 18, Phoenix hit 102 degrees. It was the earliest 100-degree day the city has ever recorded, and the cooling centers weren’t open yet.
That detail is the whole problem in miniature. The heat arrived eight days earlier than the previous record and forty-five days before the typical first triple-digit day, while the official infrastructure built to protect people from heat was still running on a summer calendar. Tempe scrambled to activate emergency centers ahead of schedule. A rapid analysis from World Weather Attribution called the March heat virtually impossible without human-caused climate change. Now imagine that same heat with the power out. That’s the scenario almost nobody plans for, and it’s the one that matters most. Heat alone is dangerous. Heat plus a blackout is a different category of event, because the thing that keeps most of us alive in extreme heat is electricity: the air conditioner, the fan, the cold water from the fridge, the phone you’d use to call for help. Take that away on a 110-degree afternoon and a survivable day becomes a lethal one.The math nobody wants to run
A team led by Brian Stone Jr. at Georgia Tech modeled what would happen if a major US city lost power during a heat wave. The numbers are sobering. They took the five-day Phoenix heat wave of 2006 and asked: what if the grid had failed at the same time? Their answer, published in Environmental Science & Technology, was that roughly half the city’s residents would need emergency care for heat illness, and around 13,250 people could die. That’s close to one percent of the population, gone in less than a week. The same model run for other cities is less catastrophic but still alarming. Heat-related deaths in Atlanta and Detroit would more than double during a blackout. In Phoenix they’d rise about sevenfold. The difference comes down to dependence: more than nine in ten Phoenix households rely on air conditioning, so when it fails, there’s nowhere for the heat to go and no acclimatization to fall back on. A model is not a prophecy. These figures describe a worst case, a total multi-day outage layered onto a record heat wave, not an ordinary Tuesday. But the trend lines underneath the model are real, and they’re moving the wrong way. Heat-season power outages have climbed sharply over the past decade, and they now make up a large share of all weather-related outages. The grid carrying that rising load is old: much of it predates 1990, and the average power transformer is pushing forty years of age with replacement lead times now stretching one to three years. Meanwhile NERC’s January 2026 assessment projects that summer peak demand will grow by 224 gigawatts over the next ten years, roughly 24 percent, driven largely by AI data centers. More demand, older equipment, hotter summers. You can see where this goes.What a Cooling Center Is, Versus What You Picture
Ask someone what a cooling center is and they’ll describe something reassuring: a clean, air-conditioned room, open when you need it, somewhere close by, staffed by people ready to help. Hold that picture, because the reality rarely matches it. Start with capacity. Existing cooling centers in a typical city can hold something like one to two percent of the population at once. They generally close in the evening, which is a problem, because in a blacked-out house the indoor temperature keeps climbing well after sunset and often peaks late at night. During one weeklong heat emergency in New York, the majority of the city’s centers were closed on Sundays[1]. Most have no backup power at all, which means the single event most likely to send people looking for a cooling center, a blackout, is also the event most likely to shut one down. Then there’s the question of whether centers even work, and here the honesty gets uncomfortable. A 2025 systematic review by the UK Health Security Agency went looking for solid evidence on cooling centers and found only five studies that met its inclusion criteria, and not a single real-world study measuring actual health outcomes. We have built a national heat-safety strategy around a piece of infrastructure we’ve barely studied. You may have seen a striking statistic used to argue that cooling centers are pointless: that it takes something like 1.6 million center visits to prevent a single death. That number is real, but the researchers who produced it explicitly called it “simplistic and meant only to illustrate a point,” and noted the figure would be far lower for people at genuinely high risk. When you re-run it for the populations centers serve, the elderly, the unhoused, the medically fragile, the number drops below a thousand visits per death prevented. That’s in the range of medical interventions we consider clearly worthwhile. Cooling centers aren’t useless. They’re just being measured against the wrong population, and built at the wrong scale, with the wrong hours, and no power.Who gets left behind
Heat is not distributed evenly, and neither is protection from it. The hottest parts of an American city tend to be the formerly redlined ones. Across more than a hundred cities, neighborhoods that were redlined in the 1930s now run about 2.6 degrees Celsius hotter on average[2] than the wealthier areas that were greenlined, a direct legacy of decades of disinvestment, less tree canopy, and more pavement. In New York, Black residents are roughly a quarter of the population and about half of the heat deaths. The pattern holds for the most vulnerable group of all. In Maricopa County, which includes Phoenix, 608 people died of heat-related causes in 2024, and 49 percent of them were experiencing homelessness. There’s a small piece of good news buried in that figure, since 2024 was the first year in a decade that the county’s heat death toll fell rather than rose. But a near-even split between housed and unhoused victims tells you that the people most likely to die in a heat wave are often the least able to reach the room with the air conditioning, and least likely to be there when it counts. This is the uncomfortable core of the cooling-center model. The people who can drive to a center, wait in line, and sit in a folding chair for six hours are usually not the people in the most danger. The ones in real danger are isolated, immobile, or unhoused. A plan that depends on those people coming to a building is a plan that will miss them.What Works Costs Almost Nothing
Here’s the finding that should reshape how you think about all of this. The strongest protector against heat death isn’t a building or a battery. It’s whether your cutting your energy costs know you exist.
In his study of the 1995 Chicago heat wave, sociologist Eric Klinenberg compared neighborhoods with nearly identical poverty rates, racial makeup, and housing stock, and found death rates that differed by as much as tenfold. The variable that explained the gap wasn’t income or air conditioning. It was social infrastructure: active sidewalks, local businesses people walked to, neighbors who noticed when someone didn’t come outside. In the neighborhoods where people were connected, somebody knocked on the door. In the ones where they weren’t, people died alone in hot apartments.
So the highest-return investment in heat resilience is also the cheapest, and it’s the one almost no funding stream pays for. You can’t buy social connection with a grant. You build it by knowing who lives around you.
That doesn’t mean infrastructure is worthless. It means it sits on top of relationships, not the other way around. With that order straight, here’s a plan that works whether or not the official system shows up.
A neighborhood plan that holds when the power doesn’t
Before anything happens, map your block. Spend an afternoon figuring out who on your street is most at risk: older neighborhood communications living alone, people with disabilities or medical equipment that needs power, anyone without working air conditioning. The Red Cross publishes a free program called Map Your Neighborhood that walks a group through this in about two hours. While you’re at it, map your assets too: who has a generator, who has solar with a battery, who has a basement that stays cool, who has medical training, who has a vehicle. Trade phone numbers and set up a simple text chain. None of this costs money. All of it pays off the first time the lights go out. Harden a few spaces, cheaply. You don’t need a quarter-million-dollar battery system to make a difference, though if your local library or community center is willing to install solar-and-battery backup, that’s worth advocating for, since libraries are already trusted, already distributed across the city, and often already have some backup power. At the household level, the low-cost moves matter more than people expect. Reflective “cool roof” coatings run well under two dollars a square foot and can drop indoor temperatures a few degrees. Shade from a strategically planted tree does the same, permanently, for the cost of the sapling. Keep a stash of battery fans, water, and a couple of reflective emergency blankets. Cooling is not only an electricity problem. When the power goes, activate the chain. The first hour is for phone calls, not panic. Work down your list and check the most vulnerable people first. Open up whatever cool spaces you’ve identified, a neighbor’s generator-backed living room, a shaded porch, a basement, and move the highest-risk people toward the places with real backup power, including hospitals and any library or facility you know stays online. The guiding principle is simple: anyone who can stay safe at home should, which frees the genuinely resilient spaces for the people who can’t. Learn the signs of heat stroke, hot dry skin, confusion, a body that’s stopped sweating, and know that it’s a 911 call, not a wait-and-see. Afterward, write down what broke. Which phone numbers were wrong. Who you couldn’t reach. Which “cool space” turned out not to be. Update the map, fix the gaps, and bring what you learned to your city or county emergency managers so the neighborhood plan and the official one start to line up.The thing the grid operators won’t tell you
There’s a comforting story going around that the grid is getting more reliable, and at the regional level it’s even partly true. Grid-scale batteries have gotten good at preventing the big system-wide blackouts; California got through a brutal 2024 heat wave without rolling outages largely because of them. But those batteries do nothing for the failure that’s most likely to hit your street: a transformer that cooks and explodes, a line that comes down, a substation that floods. Most outages are local distribution failures, and a regional battery farm a hundred miles away cannot help you when the transformer on your own pole gives out. Your neighborhood can lose power while the wider grid is perfectly fine.
Which brings it back to where it started, on a Phoenix street in March, with the heat arriving early and the official help not yet open for the season. Don’t build your plan on federal disaster money; heat barely qualifies as a disaster in the way that system is written, and the funding that does exist has been chaotic and litigated. Don’t build it on a cooling center that may be closed, far away, or dark. Build it on the people within shouting distance of your front door, because when the grid goes down in a heat wave, they’re who will be there.
Start with the people. The rest is just equipment.
—References
[1]: Office of the New York City Comptroller. (2024). “Overheated, Underserved: Expanding Cooling Center Access.” https://comptroller.nyc.gov/reports/overheated-underserved/ [2]: Hoffman, J.S., Shandas, V. and Pendleton, N. (2020). “The Effects of Historical Housing Policies on Resident Exposure to Intra-Urban Heat: A Study of 108 US Urban Areas.” Climate, 8(1), 12. https://pdxscholar.library.pdx.edu/usp_fac/261/ [3]: UK Health Security Agency. (2025). “Public Health Effectiveness of Cooling Centres During Periods of Hot Weather.” Systematic Review. https://researchportal.ukhsa.gov.uk/en/publications/public-health-effectiveness-of-cooling-centres-during-periods-of-/ [6]: NERC. (2026). “Long-Term Reliability Assessment.” https://www.utilitydive.com/news/nerc-10-year-peak-demand-forecast-jumps-24-on-new-data-center-loads/810955/ [7]: World Weather Attribution. (2026). “Record-Torching March Heat Virtually Impossible Without Climate Change.” https://yaleclimateconnections.org/2026/03/record-torching-march-heat-virtually-impossible-without-climate-change/ [8]: Red Cross. “Extreme Heat Safety and Map Your Neighborhood.” https://www.redcross.org/get-help/how-to-prepare-for-emergencies/types-of-emergencies/extreme-heat-safety.htmlRelated reading
 The Connected Community
The 3D Printing Revolution in Your Backyard: How a Printer Can Build a Stronger Community
We’ve all been there. The plastic handle on a favorite appliance snaps. A crucial knob on the dishwasher breaks off. A child’s…
 The Connected Community
Community Mesh Networks: Your Guide to a Local Comms Grid When the Internet Goes Down
Picture this: a fierce summer thunderstorm rolls through, more intense than predicted. The power flickers and dies. You check your phone—no signal.…
 The Connected Community
A Practical Guide to Starting a Skill-Sharing Group in Your Community
In an age where we can connect with anyone online, our most durable connections are still local. A practical guide to…
Related reading
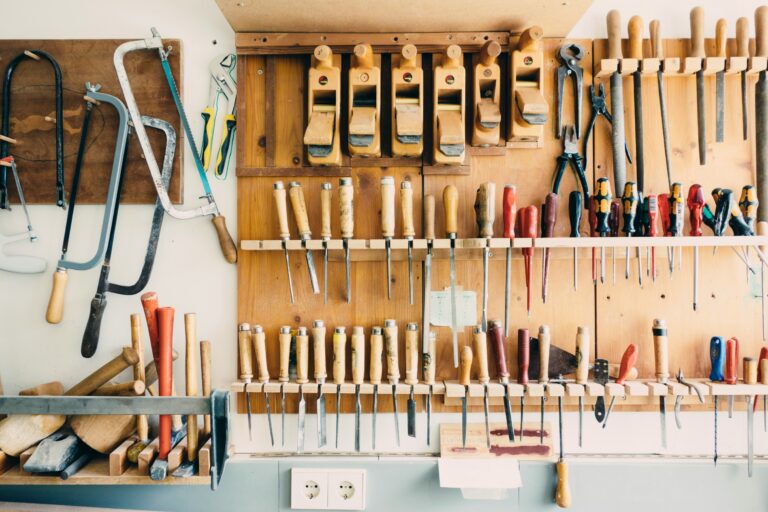
Starting a Neighborhood Tool Library, From Idea to Grand Opening
There are roughly 250 formal tool libraries operating across North America right now, about two and a half times as many as in 2018 and …
The 3D Printing Revolution in Your Backyard: How a Printer Can Build a Stronger Community
We’ve all been there. The plastic handle on a favorite appliance snaps. A crucial knob on the dishwasher breaks off. A child’s toy, once beloved, …
Community Mesh Networks: Your Guide to a Local Comms Grid When the Internet Goes Down
Picture this: a fierce summer thunderstorm rolls through, more intense than predicted. The power flickers and dies. You check your phone—no signal. The cell towers, …